 By Editorial Team
A/B testing ad copy is a powerful tool, but even seasoned marketers often stumble into common pitfalls that skew results or waste valuable budget. Getting your tests right means unlocking genuine insights into what resonates with your audience, leading to significantly better campaign performance. Are you sure your current A/B tests are truly delivering accurate, actionable data?
Key Takeaways
- Always isolate a single variable per test to ensure clear attribution of performance changes to specific ad copy elements.
- Determine your minimum detectable effect (MDE) and calculate the required sample size before launching any A/B test to guarantee statistical significance.
- Run tests for a full business cycle (typically 7-14 days) to account for daily and weekly audience behavior fluctuations.
- Integrate your A/B testing efforts with a robust customer relationship management (CRM) platform like Salesforce to analyze long-term customer value, not just immediate click-through rates.
- Prioritize testing calls-to-action (CTAs) and headline variations, as these elements often yield the most significant impact on conversion rates.
We’ve all been there: staring at a spreadsheet of A/B test results, scratching our heads, wondering why the “winner” isn’t actually driving more sales. I’ve personally seen campaigns burn through thousands of dollars on inconclusive tests because of fundamental errors in setup. My goal here is to share the hard-won lessons from years of running high-stakes ad campaigns, so you can avoid those same costly mistakes.
1. Testing Too Many Variables at Once
This is, hands down, the most common and damaging mistake I see. People get excited about A/B testing and try to change the headline, the body copy, the CTA, and even the image all in one go. When one version performs better, what did you actually learn? Was it the headline? The CTA? The combination? You simply don’t know. It’s like trying to bake a cake and changing five ingredients simultaneously – if it tastes terrible, you have no idea which ingredient was the culprit.
Pro Tip: Focus on isolating a single, impactful variable. Start with the headline, then the CTA, then the unique selling proposition (USP) in the body copy. This methodical approach builds a clear understanding of what drives your audience.
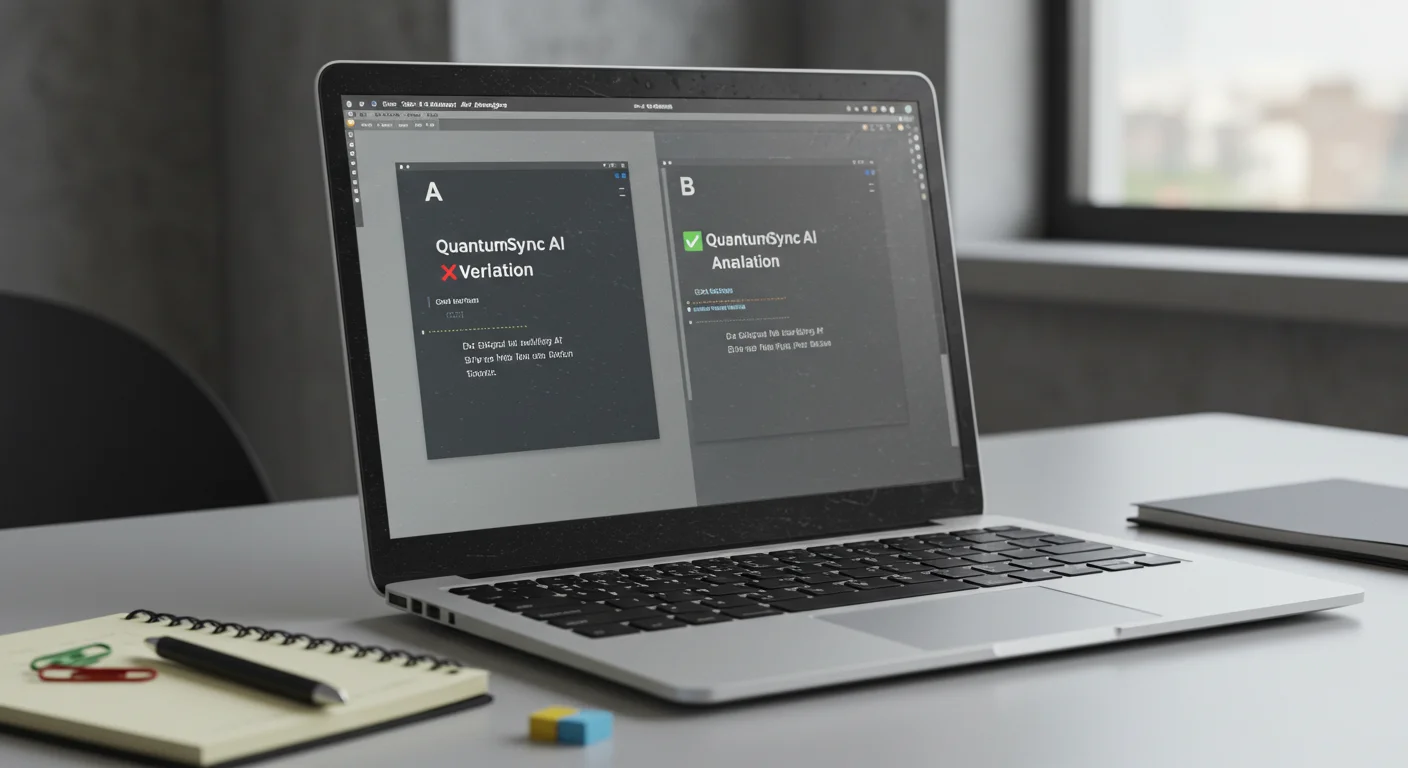
Common Mistake: Launching a test with “Ad A” having a different headline and image than “Ad B,” then attributing success solely to “Ad B” without understanding which specific element caused the lift.
When setting up your test in Google Ads, for example, create your initial ad. Then, use the “Experiments” feature. You’ll duplicate your original ad and meticulously edit only one element. For instance, if you’re testing headlines, ensure everything else – descriptions, display URL, final URL, ad extensions – remains identical. The interface for creating ad variations under “Experiments” clearly guides you to select which parts of the ad you want to modify. You’ll choose “Headline” from the “Type of change” dropdown.
2. Neglecting Statistical Significance and Sample Size
Running a test for a day with 50 clicks and declaring a winner is not just premature; it’s statistically irresponsible. You need enough data for the results to be reliable, meaning the observed difference isn’t just due to random chance. This is where statistical significance comes in. Many marketers skip this crucial step, leading to false positives and wasted effort.
Editorial Aside: Look, I get it. We all want quick answers. But rushing a test is like pulling a cake out of the oven too early – it might look done on the outside, but it’s raw in the middle. Patience is a virtue in A/B testing, and it pays dividends.
Before you even launch, calculate your required sample size. Tools like Optimizely’s A/B Test Sample Size Calculator are invaluable. You’ll need to input your baseline conversion rate, your desired minimum detectable effect (MDE – the smallest difference you care to detect), and your desired statistical significance level (typically 90% or 95%). For instance, if your current conversion rate is 3% and you want to detect a 20% improvement (i.e., a new conversion rate of 3.6%) with 95% confidence, the calculator will tell you exactly how many conversions (and thus, how many impressions/clicks) you need for each variation.
Case Study: The “Free Shipping” Headline
Last year, I worked with a client, a local e-commerce store specializing in artisanal candles, located just off Peachtree Street in Atlanta. Their average order value was $45, and their baseline conversion rate from paid ads was 2.8%. We were testing a new headline for their Google Search Ads: “Hand-Poured Candles” (control) vs. “Free Shipping on All Orders” (variant).
Using a sample size calculator, aiming for a 15% MDE (detecting a lift to 3.22%) at 95% confidence, we determined we needed approximately 1,500 conversions per variation. Given their average click-through rate (CTR) and conversion rate, this meant we needed about 55,000 clicks per variation, equating to roughly 500,000 impressions over a two-week period.
We ran the test for 16 days. The “Free Shipping” headline achieved a 3.5% conversion rate, a statistically significant 25% increase over the control’s 2.8%. This wasn’t just a hunch; the data was undeniable. Implementing this headline universally across their ad sets led to a 20% increase in monthly online revenue, translating to an extra $3,000 per month for this small business.
“Recent data shows that 88% of marketers now use AI every day to guide their biggest decisions, and for good reason. Marketing automation has been shown to generate 80% more leads and drive 77% higher conversion rates.”
3. Ending Tests Too Soon or Running Them Too Long
Just as ending a test too soon can lead to false positives, running it indefinitely can be problematic too. If you’ve reached statistical significance and the results are clear, continuing to run the test simply means you’re potentially losing out on the gains of the winning variation. Conversely, stopping a test before it reaches significance, even if one variation “looks” better, is a common trap.
Pro Tip: Define your test duration and sample size before you start. Stick to it. Don’t peek and make snap decisions. A Nielsen report on ad effectiveness emphasizes the importance of consistent measurement periods for accurate comparison.
Most tests should run for at least one full business cycle, typically 7-14 days. This accounts for variations in user behavior throughout the week (e.g., weekend browsing vs. weekday purchasing). Sometimes, for lower-volume campaigns, you might need to extend it to 3-4 weeks to gather enough data.
4. Ignoring External Factors and Seasonality
Your A/B test isn’t happening in a vacuum. A holiday sale, a major news event, or even a competitor’s aggressive campaign can significantly impact your results. If you launch a test during Black Friday, for example, your conversion rates will likely be inflated for both variations, making it difficult to ascertain the true impact of your ad copy change under normal conditions.
Common Mistake: Launching a test for a fitness product in late December and attributing a spike in conversions solely to new ad copy, when the surge is more likely due to New Year’s resolutions.
Always consider the context. If you’re running a test on a new ad copy for a landscaping service in Alpharetta, launching it during a sudden cold snap in January might yield artificially low results, regardless of how good the copy is. Try to run your tests during periods of relatively stable external conditions to get the most accurate read on your ad copy’s effectiveness.
5. Failing to Test the Call-to-Action (CTA)
The CTA is arguably the most critical part of your ad copy. It’s the instruction you give your audience. Yet, many marketers spend hours crafting headlines and descriptions but leave the CTA as a generic “Learn More” or “Shop Now.” This is a massive missed opportunity. A strong, benefit-driven CTA can dramatically increase click-through and conversion rates.
Pro Tip: Test specific, action-oriented CTAs that align with the next step in your funnel. Instead of “Download Now,” try “Get Your Free Ebook Instantly.” For a service, “Request a Quote” might outperform “Contact Us.”
I’ve seen “Get My Custom Plan” outperform “Sign Up” by 30% for a subscription service. The difference? Specificity and a clear benefit. In Meta Ads Manager, when creating an ad, the “Call to Action” button is a dropdown menu. While Meta offers standard options, you can often customize the primary text in your ad copy to act as a more specific CTA, or you can leverage different button options like “Get Quote,” “Apply Now,” or “Book Now” depending on your objective. This is where you can get creative and test different button texts as your variable.
6. Not Connecting Ad Copy Tests to Down-Funnel Metrics
A/B testing ad copy solely on click-through rate (CTR) or even conversion rate (CVR) can be misleading. A copy variation might get more clicks or even more conversions, but if those conversions are lower quality, result in higher refund rates, or attract customers with lower lifetime value (LTV), then you haven’t truly won.
Pro Tip: Always link your ad copy tests to your CRM data. Track which ad variations lead to qualified leads, completed sales, and ultimately, profitable customers.
For example, a marketing agency in Buckhead, Atlanta, ran a test on two ad copy variations for a Google Search ad promoting their SEO services. Ad A focused on “Affordable SEO Packages” and had a slightly higher CVR for “contact us” form fills. Ad B focused on “Results-Driven SEO Strategies” and had a slightly lower CVR. However, when we looked at the quality of leads in their Salesforce CRM, leads from Ad B were 2x more likely to become paying clients and had a 15% higher average contract value. The initial “winner” based on CVR was actually driving less profitable business. This is why you must look beyond the immediate click. To avoid such pitfalls and ensure your marketing efforts truly pay off, understanding why data dominates Marketing ROI is essential.
7. Copying Competitors Without Testing
It’s tempting to look at what successful competitors are doing and simply replicate their ad copy. After all, if it works for them, it should work for you, right? Not necessarily. Your audience, brand voice, unique selling propositions, and even your landing page experience are all different. What resonates with their customers might fall flat with yours.
Common Mistake: A smaller competitor in the home services niche in Smyrna, GA, copied a larger national brand’s ad copy verbatim, only to find their cost-per-click (CPC) skyrocket and conversion rates plummet. The national brand had established trust and recognition that the local business lacked, making their direct-response copy effective where the smaller company needed more trust-building language.
My Opinion: Competitor analysis is valuable for inspiration, not duplication. Use their successful campaigns as a hypothesis to test, not as a blueprint to copy blindly. Your audience is unique, and your copy should reflect that. For further insights on ensuring your campaigns are effective and not falling into common traps, explore PPC Myths Costing You Millions in 2026.
8. Failing to Document and Analyze Results Systematically
Without proper documentation, your A/B tests are just isolated experiments. You’ll forget what you tested, why you tested it, and what you learned. This leads to repeating tests, missing patterns, and generally wasting valuable time and resources.
Pro Tip: Maintain a detailed A/B test log. Include the hypothesis, variations tested, start/end dates, sample size, statistical significance, key metrics (CTR, CVR, CPA), and most importantly, the insights gained.
I recommend a shared spreadsheet or a dedicated project management tool for this. For every test, we record:
- Test ID: Unique identifier (e.g., GA-H-001)
- Hypothesis: “We believe changing the headline to ‘Free Shipping’ will increase CVR by 15%.”
- Variables: Specific element changed (e.g., Headline 1 vs. Headline 2)
- Platforms: Google Search, Meta Ads
- Audiences: Which segments were targeted
- Start Date/End Date: When the test ran
- Results: Raw data for key metrics
- Statistical Significance: Yes/No, and confidence level
- Key Learnings: What did we actually discover?
- Next Steps: What test should this lead to?
This systematic approach allows you to build a library of insights over time, informing future campaign strategies and preventing redundant efforts. To truly maximize your return on investment, remember that boosting ROAS by 25% requires continuous optimization and understanding of your data.
A/B testing ad copy is an ongoing journey of refinement, not a one-time fix. By diligently avoiding these common mistakes, you’ll conduct more reliable tests, gain deeper insights into your audience, and ultimately drive superior marketing performance.
How long should an A/B test run to get reliable results?
An A/B test should ideally run for at least one full business cycle, typically 7 to 14 days, to account for daily and weekly fluctuations in user behavior. More importantly, it should run until it reaches statistical significance, which depends on your baseline conversion rate, desired minimum detectable effect, and traffic volume.
What is “statistical significance” in A/B testing?
Statistical significance means that the observed difference between your ad copy variations is unlikely to have occurred by random chance. It indicates how confident you can be that the winning variation genuinely performs better, typically aiming for 90% or 95% confidence levels.
Can I A/B test ad copy on multiple platforms simultaneously?
Yes, you can test ad copy on platforms like Google Ads and Meta Ads simultaneously, but treat each platform’s test as separate. User behavior and ad formats differ significantly between platforms, so a winning copy on one might not perform the same on another. Always analyze results independently for each platform.
What is the “Minimum Detectable Effect” (MDE) and why is it important?
The Minimum Detectable Effect (MDE) is the smallest percentage change in your key metric (e.g., conversion rate) that you consider meaningful enough to act upon. It’s crucial because it helps calculate the sample size needed for your test; a smaller MDE requires a larger sample size to detect the difference reliably.
Should I always keep the winning ad copy running indefinitely?
While you should implement the winning ad copy, it’s not a set-it-and-forget-it solution. Ad copy effectiveness can decay over time due to audience fatigue or market changes. Continuously monitor its performance and plan follow-up tests to refine or challenge your current winning copy, ensuring sustained optimal results.


